3.3. Standardized Indicator of the Rate of Children and Adolescents Homicide (0-18 Years Old) 2010 and the Variation Rate of Children and Adolescents Homicide (0-18 Years Old) 2009-2010
The analysis of the indicator notes the intentional violent deaths committed against children and adolescents occurred in 2010, and the variation of this indicator in each region compared to the previous, i.e., from 2009 to 2010. Through that it is possible to estimate the lethal violence practiced against specific age groups that are more vulnerable, or the risk mortality caused by homicides of children and adolescents. It considers the number of deaths of children (from 0 to 9 years old) and adolescents (from 10 to 18 years old) for every 100,000 inhabitants from 0 to 18 years old, and includes deaths due to intentional aggression of others, which use any means to cause harm, injure or kill the victim.
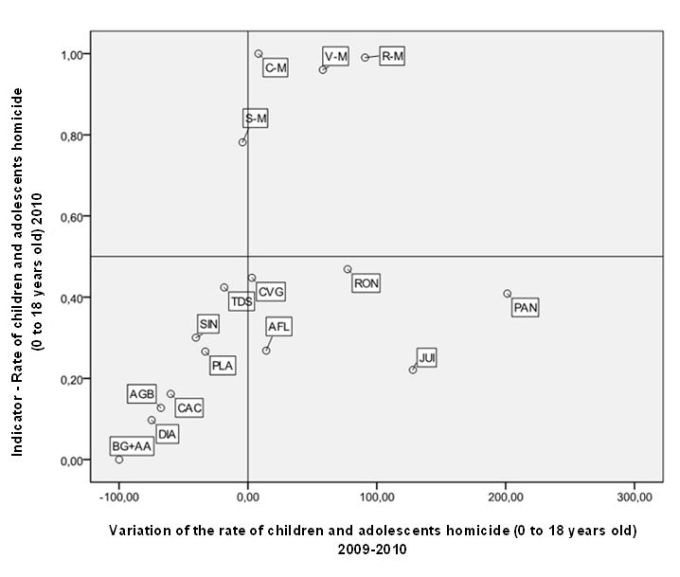
Figure 7, below, shows the location of diagnosis regions, according to standardized indicator of the rate of 2010 and the variation rate from 2009 to 2010.
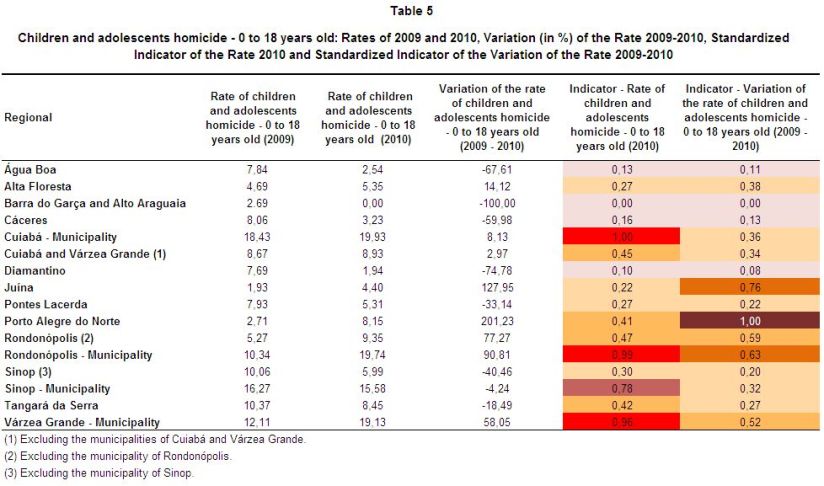
According to this figure, the region of the Rondonopolis municipality, the Várzea Grande municipality and, to a lesser extent, the Cuiabá municipality, had the most critical frame in the violent deaths of children and adolescents in the state, given the high values for the rate’s standardized indicator in 2010 and the increase of these rates from 2009 to 2010, as shown in Table 5 and Maps 8 and 9.
In addition to those regions in the upper-right, there is a worrying situation in the municipality of Sinop, in which has been recorded a high rate of homicides of children and adolescents in 2010, although there was a slight reduction of this indicator from 2009 to 2010.
The regions of Rondonopolis, Juína and, in particular, Porto Alegre do Norte, present a situation of “alert” due to the considerable increase in the rate of homicides of children and adolescents from 2009 to 2010. The location of these regions in the scatter chart (lower right) and their ranking on the map that represents the variation of the standardized indicator illustrates this situation. In the case of Porto Alegre do Norte, the level of the indicator in 2010 was “middling” and the variation of this indicator was “very bad.” It is also important to monitor the situation of Juína, which showed a relatively low rate of homicides of children and adolescents in 2010, but suffered a major deterioration from 2009 to 2010.
Figure 7
Correspondence between the Standardized Indicator of the Rate of Children and Adolescents Homicide (0-18 Years old) 2010 and the Variation of Rate of Children and Adolescents Homicide (0-18 Years old) 2009-2010
Source: Health Department of the State of Mato Grosso.
Note: AGB = Água Boa, AFL = Alta Floresta, BG + AA = Barra do Garças + Alto Araguaia, CAC = Cáceres, C-M = Cuiabá – Municipality, CVG = Cuiabá e Várzea Grande, DIA = Diamantino, JUI = Juina, PLA = Pontes Lacerda, PAN = Porto Alegre do Norte, RON = Rondonópolis, R-M = Rondonópolis – Municipality, SIN = Sinop, S-M = Sinop – Municipality, TDS = Tangará da Serra, V-M = Várzea Grande – Municipality.
On the other hand, the region of assemblage Barra do Garças and Alto Araguaia — located in the lower left quadrant of the chart — presented a situation that is considered “good” because it had the lowest value for the rate in analysis for 2010, and the largest reduction in this indicator between 2009 and 2010 as shown in Table 5. On the same quadrant, we highlight the regions Diamantino, Água Boa and Caceres, which also presented low values for the standardized indicator of the year and good reductions on their respective rates.
The synthesis of the results for the indicator is in Table 5 and on Maps 8 and 9 below.
The synthesis of the results for the indicator is in Table 5 and on Maps 8 and 9 below.
Map 8
Standardized Indicator of Rate of Children and Adolecents Homicide (0-18 Years) 2010
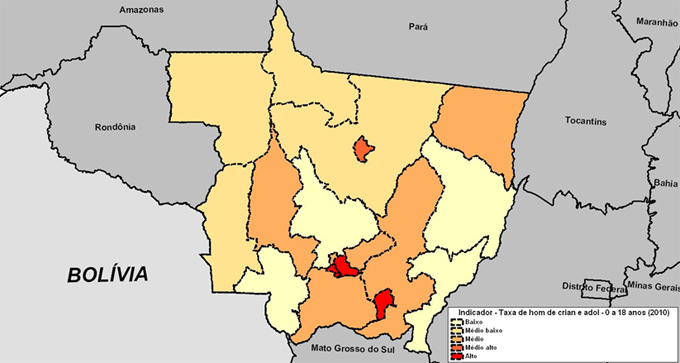
Note: Low = Up to 0.2, Medium Low = More than 0.2 to 0.4, Medium = More than 0.4 to 0.6; Medium High = More than 0.6 to 0.8, High = more 0.8.
Map 9
Standardized Indicator of the Variation Rate of Children and Adolescents Homicide (0-18 Years old) 2009-2010
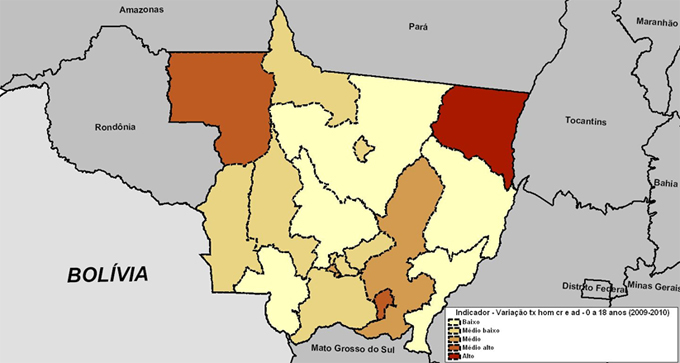
Note: Low = Up to 0.2, Medium Low = More than 0.2 to 0.4, Medium = More than 0.4 to 0.6; Medium High = More than 0.6 to 0.8, High = more than 0.8