Geolocation system offers information on 12,000 public schools in the São Paulo Metropolitan Area
A platform developed by the Center for Metropolitan Studies (CEM) provides a large amount of information about every school in the São Paulo Metropolitan Area
Janaína Simões
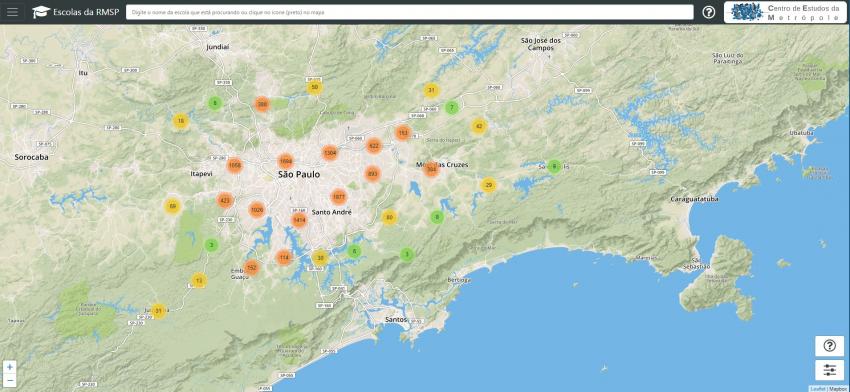
A huge GIS database including almost 12 thousand public and private schools in the São Paulo Metropolitan Area (RMSP) is available for online consultation through a platform developed by the Center for Metropolitan Studies (CEM-Cepid/Fapesp). The platform allows users to obtain data on the performance and institutional profiles of different schools, browse socioeconomic, educational, and demographic information, and compare them to local schools and with indicators for the RMSP, the state of São Paulo and Brazil. It also provides data on each school’s facilities, educational statistics and administration. The system can be consulted on the CEM website: http://200.144.244.241:3002/geolocation.
The platform can be used by anyone who wishes to find out more about the education system, not only for academic purposes. It includes general information on public and private schools, at both elementary and high school level. This includes, for example, educational statistics on the turnover of teaching staff, an indicator that measures the presence of the same teachers in the school for consecutive years, or even the degree of complexity of the school management, an indicator that combines, in a single measure, information on size, working shifts, level of complexity of the educational stages (kindergarten, elementary, middle and high school, youth and adult education) and the number of stages offered.
Other data available include the number of employees, availability of specialized assistance, disabled access (to bathrooms and roads), food, sanitation, equipment (TV, DVD, computers, internet, broadband access). The platform developed by CEM also details the school's infrastructure: whether it has a computer lab, library, children's toilet, cafeteria, sports facilities etc.
Using the system, it is also possible to browse the socioeconomic characteristics of the school and its surroundings, such as the income distribution of the neighborhood. The platform shows the poverty rate, household income per capita and the Gini Index of the local area. The same can also be done in relation to educational characteristics, literacy rates, the frequency and level attended by age groups, and the racial characteristics of students. The platform provides data for the selected school, others in the same neighborhood, the RMSP, the State of São Paulo and Brazil, allowing comparisons to be made.
According to Rogério Barbosa, a Postdoctoral Fellow at CEM, who coordinated the construction and development of the system, research in education has already shown that a significant part of student performance is related to a combination of family and neighborhood conditions. “When comparing schools in similar neighborhoods, we can see what the differences are: if one is receiving more or less resources than the other, if it has better trained teachers, and so on”, he says. “When we take the characteristics of the school, family and the socioeconomic context in which the student is situated, we gain a more comprehensive view”, he adds.
The development of the neighborhood concept beyond the idea of physical proximity is one of the innovations applied to the system. “An example is the indicator of the occupational and educational composition of each area. A school in a neighborhood where a significant proportion of residents has completed high school and/or higher education will tend to be attended by children who are supported by parents with their schooling and therefore do better at school”, he says.
"It is worth mentioning, however, that it is not valid, from a methodological perspective and certainly not a social one, to compare schools in regions with very different socioeconomic indicators", he explains. Students who attend public schools located in areas with better socioeconomic indicators are likely to be middle class and bring with them cultural and educational background inherited from the family, are in a region that provides access to more cultural goods, etc. “The basic idea of comparing schools cannot result in some sort of ranking of the best and worst schools, nor does it serve to stimulate competitiveness, on the contrary”, he adds.
Construction of the system
Launched in 2015, the RMSP School Geolocation System uses updated and integrated indicators from school censuses conducted by the Ministry of Education (MEC) between 2005 and 2016; specialized evaluations (Saeb, Prova Brasil and Enem) and the 2010 Demographic Census of the Brazilian Institute of Geography and Statistics (IBGE). With the support of grant-holders, Daniel Waldvogel Thomé da Silva and José Donizete Cazzolato, geogrphers and members of the CEM transfer team, were responsible for carrying out the georeferencing work.
For this stage, the cartographic base of streets developed by CEM was used, which encompasses the 39 municipalities of the RMSP. “Most of the addresses on the school census were not accurate. Sometimes it was recorded wrong, sometimes the address was inaccurate, or the school had moved. It was a very careful job to be able to generate reliable information about schools, which included looking on the websites of individual schools, the city and state governments, checking on Open Street Maps, Google Street View etc”, says Barbosa.
In the school census, carried out by the National Institute of Educational Studies and Research Anísio Teixeira (Inep), an agency of the Ministry of Education, and in standardized tests, each school has a unique identifier code, called an ID. These allowed information from various databases to be imported and allocated to each school.
A specific strategy was developed to integrate each school with the data of the demographic census. They appear in polygons on the map of the CEM system that defines the so-called weighting areas, a spatial approach adopted by the IBGE that delimits areas of approximately 10,000 to 15,000 people. These areas are made up of census sectors, which, in turn, are sets of households (varying, numerically, between 250 and 350) in which a single interviewer can apply the Census questionnaire. “Cross-checking the school's geolocation with the demographic census data for the weighting area where it is located, we were able to collect socioeconomic data from the neighborhood and assign them to the school”, explains Barbosa.
The RMSP School Geolocation System was CEM's first experience of using a webmap. The knowledge obtained by researchers in the development of ReSolution, a platform that brings together unprecedented indicators from across the metropolitan area, contributed to the advancement of the school system. “We had a convergence between CEM’s experience in relation to educational databases, previous work on inequality in education and already accumulated knowledge of georeferencing, with the georeferencing of various services and institutions in the RMSP. The School Geolocation System was an application of CEM’s capacity to a specific subject.”
According to Barbosa, the system developed for schools in the RMSP is easily replicable for other cities and regions. "We extensively documented the process, used open source software and everything is available", he tells us. Anyone interested in replicating the process will one need to invest in the geolocation of the schools themselves. “As with the RMSP, there may be incomplete information about schools, which requires manual checking. Once you have the addresses of the schools, the rest is possible to develop from public databases that have already been extensively developed by CEM ”, he concludes.
Midia Press
Janaína Simões
E-mail: imprensa.cem@usp.br
Phone: 55 (11) 3091-2097 / 55 (11) 99903-6604


