2. Standardization of Indicators
As previously explained the adopted evaluation model requires us to calculate the synthetic indexes for the Brazilian municipalities regarding their health and education policy results. For the configuration of the two indexes, all component indicators were standardized in a scale from 0 to 1, in order to ease the data interpretation. For this we used the following standardization:
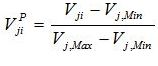
where “j” corresponds to the variable number and “i” to the municipality.
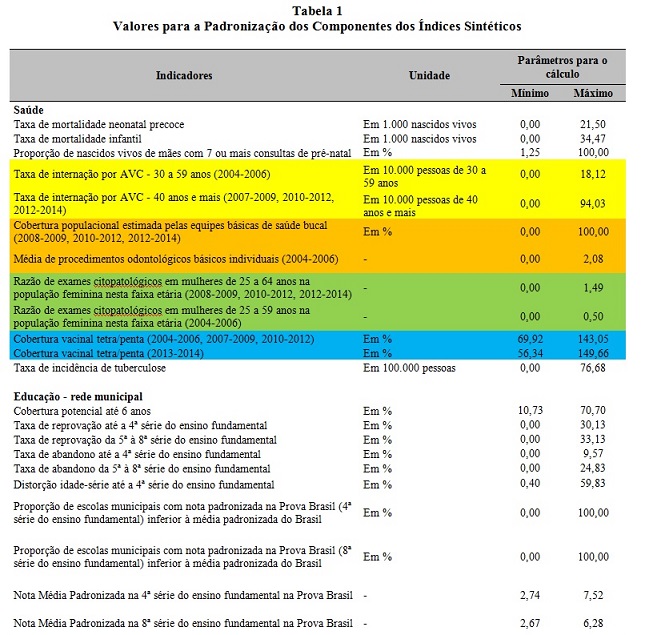
The minimum and maximum values used for the standardization are displayed in Table 2. It should be mentioned that for a large part of the indicators the superior and inferior “outliers” were excluded, observed in the distribution of the indicator’s brute values, for the definition of minimum and maximum values adopted in the standardization. Furthermore, in order to verify the temporal evolution of the synthetic indexes with the same “theme” (that is, “health” and “education – municipal system”), we adopted the following methodology for defining minimum and maximum values:
• Health Field: Initially we obtained the minimum and maximum values used for the standardization for each one of the indicators referring to the period of 2007-2009. Then we reproduced these same values for the standardization of each one of the indicators for 2004-2006, 2010-2012 and 2012-2014. It should be mentioned that for the period of 2004-2006, 3 indicators had their minimum and maximum values calculated in a similar manner to the indicators referring to the period of 2007-2009: hospitalization rate for stroke - 40 years and over; average individual basic dental procedures; reason cytopathology - 25-59 years; already for the period 2012-2014, an indicator (immunization coverage tetra / pentavalent 2013-2014) had its minimum and maximum values calculated similarly to 2007-2009 indicators.
• Education field – municipal system: initially we obtained the minimum and maximum values used for the standardization for each one of the indicators referring to the period of 2007-2009. Then we reproduced these same values for the standardization of each one of the indicators for 2004-2006, 2010-2012 and 2012-2014.
table under translation