3.6. Standardized Indicator of the Rate of Property Crimes (Vehicles) 2010 and the Variation Rate of Property Crimes (Vehicles) 2009-2010
The indicator points to property crimes with and without use of violence and/or threat, specifically from vehicles, that occurred in 2010 and the variation of this indicator in each region compared to the previous one, i.e., from 2009 to 2010. It considers the number of criminal incidents per 100,000 vehicles and includes robbery (subtracting an alien movable property practicing violence and/or threat) and theft (subtracting an alien movable property without using violence and/or threat) of vehicles.
Figure 10 below shows the regional location of diagnosis according to standardized indicator of the rate of 2010 and the variation in rate from 2009 to 2010.
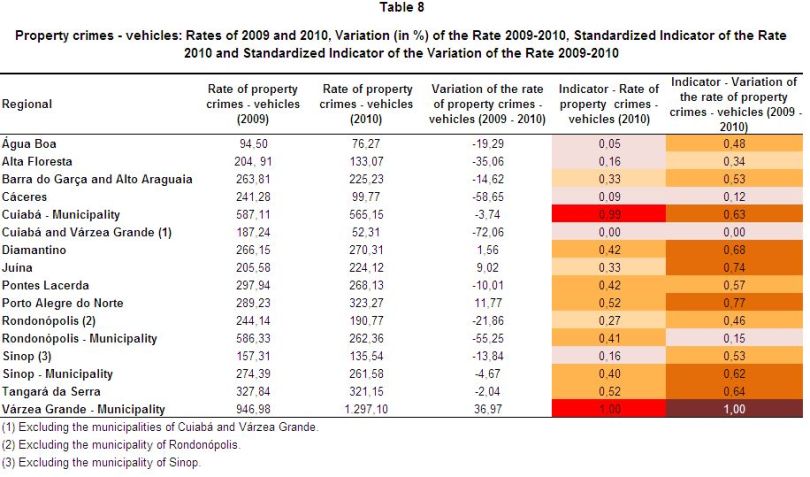
In general, it is observed that this indicator is the one with the largest reduction for all the regions in the State of Mato Grosso, between 2009 and 2010. In other words, the increase in this type of crime was recorded in regions or specific contexts in the State of Mato Grosso. In the period under consideration, increases were registered in the rates of property crimes (vehicles) only in the following regions: Várzea Grande-Municipality (mainly), Porto Alegre do Norte, Juína and Diamantino.
The most critical levels of vehicle thefts and robbery in 2010 were observed in the cities of Cuiabá and Várzea Grande municipality, located in the upper right and upper-center position in the scatter chart. The municipality of Várzea Grande combines a high level of this indicator (the highest rate in 2010) with a sharp increase in this type of crime (higher variation rate in 2009 and 2010). On the other hand, the City of Cuiabá presented a high value of this rate in 2010 and a slight reduction in this indicator over the period analyzed.
The regions Juína and Porto Alegre do Norte presented unsatisfactory levels of the indicator in 2010 and growth into the “upper-middle” of criminality from 2009 to 2010. The situation in which regions can be better viewed is in Maps 14 and 15. The frame of these regions is concerning, because if this trend does not change over the coming years, the criminality situation in regard to vehicles theft and robbery can become critical.
Figure 10
Correspondence Between the Standardized Indicator of the Rate of Property Crimes (Vehicles) 2010 and Variation Rate of Property Crimes (Vehicles) 2009-2010
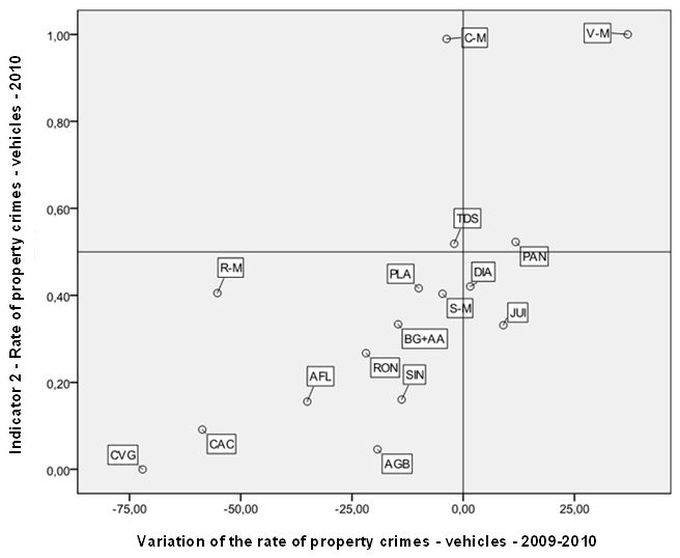
Source: Judicial Police of the State of Mato Grosso
Nota: AGB = Água Boa, AFL = Alta Floresta, BG + AA = Barra do Garças + Alto Araguaia, CAC = Cáceres, C-M = Cuiabá – Municipality, CVG = Cuiabá e Várzea Grande, DIA = Diamantino, JUI = Juina, PLA = Pontes Lacerda, PAN = Porto Alegre do Norte, RON = Rondonópolis, R-M = Rondonópolis – Municipality, SIN = Sinop, S-M = Sinop – Municipality, TDS = Tangará da Serra, V-M = Várzea Grande – Municipality.
Finally, there are two regions that presented low levels of the indicator in 2010 concurrent with a major reduction in the rate between 2009 and 2010. They are the regions of Cuiabá and Várzea Grande (excluding major cities) and Cáceres.
A summary of the results obtained for the indicator is in the Table 8 and Maps 14 and 15 below.
Map 14
Standardized Indicator of Crimes Against Property Rate - Vehicles 2010.

Note: Low = Up to 0.2, Medium Low = More than 0.2 to 0.4, Medium = More than 0.4 to 0.6; Medium High = more than 0.6 to 0.8, High = more than 0.8.
Map 15
Standardized Indicator of Crimes Against Property Rate Variation- Vehicles 2009-2010

Note: Low = Up to 0.2, Medium Low = More than 0.2 to 0.4, Medium = More than 0.4 to 0.6; Medium High = more than 0.6 to 0.8, High = more than 0.8.