2. Standardization of indicators
The evaluation model adopted involves calculating two synthetical indicators for the region of Mato Grosso State with respect to the results of its security policy: one related to rates of 2010, called “Index of Criminality and Victimization (2010)”; another, associated with variations in rates between 2009-2010, called “Variation Index (2009-2010).” In the composition of the indexes, all indicator components have been standardized in the range of 0 to 1, to facilitate the data interpretation. For this purpose, the following standards have been used:
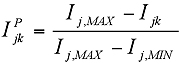
where: I = indicator
j = number of the indicator
k = regional
MIN = minimum value
MAX = maximum value
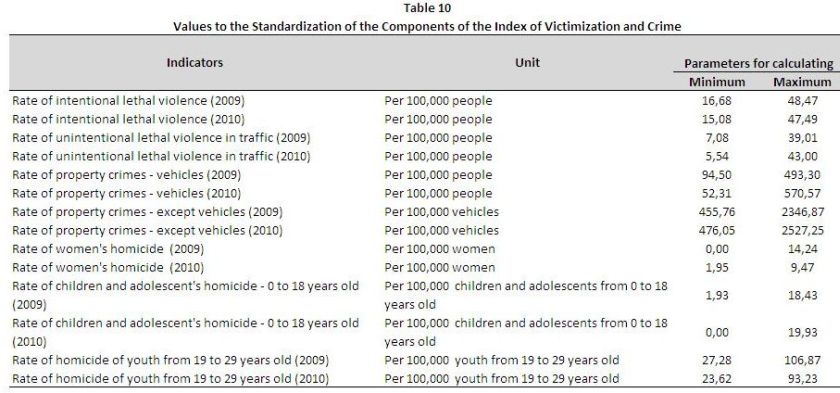
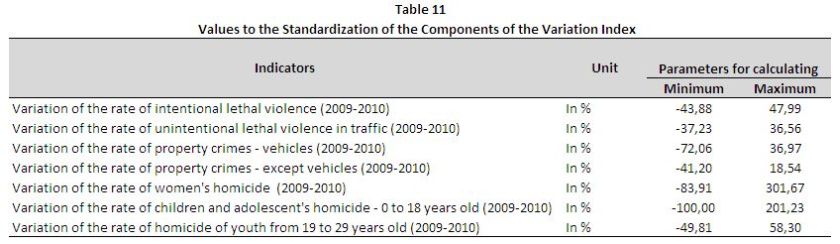
The minimum and maximum values used in the standardization are shown in Tables 10 and 11. It should be noted that for some indicators, the definition of maximum and minimum values for standardization excluded “outliers,” lower and upper, observed in the distribution of the gross values and the variations of rates.
The Index of Criminality and Victimization and the Variation Index should be interpreted as follows: the closer to zero (0), the better the situation of the region regarding criminality and victimization (or with respect to the variation); the closer to ten (10), the worse the situation.
Similarly, the standard components to both indexes have the following meanings: the closer to zero (0), the better the situation of the region regarding the indicator on display (or related to the variation of the indicator); closer to one (1) means a worse situation.