3.1. Standardized Indicator of the Rate of Intentional Lethal Violence 2010 and the Variation Rate of Intentional Lethal Violence 2009-2010
Analysis of the rate of intentional lethal violence and observed intentional violent deaths that occurred in 2010, and the variation of this indicator in each region compared to previous year, i.e. 2009 to 2010. This takes into consideration the number of deaths per 100,000 inhabitants and includes the following criminal occurrences: murder; injury followed by death of the victim and robbery followed by death (aggravated burglary).
Figure 5, below, shows both the standard indicator of the rate of Intentional Lethal Violence in 2010 and the variation rate from 2009 to 2010.
Figure 5
Correspondence between the Standardized Indicator of the Rate of Intentional Lethal Violence 2010 and the Variation Rate of Intentional Lethal Violence 2009-2010
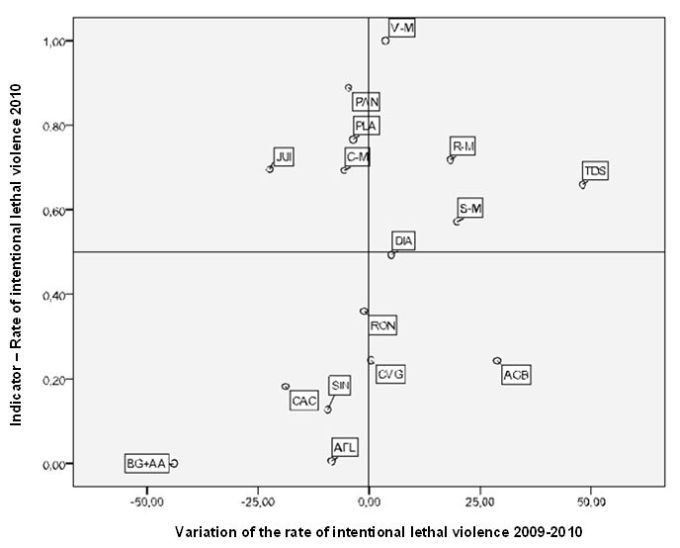
Source: Civil Judicial Police of the State of Mato Grosso.
Note: AGB = Água Boa, AFL = Alta Floresta, BG + AA = Barra do Garças + Alto Araguaia, CAC = Cáceres, C-M = Cuiabá – Município, CVG = Cuiabá e Várzea Grande, DIA = Diamantino, JUI = Juina, PLA = Pontes Lacerda, PAN = Porto Alegre do Norte, RON = Rondonópolis, R-M = Rondonópolis – Município, SIN = Sinop, S-M = Sinop – Município, TDS = Tangará da Serra, V-M = Várzea Grande – Município.
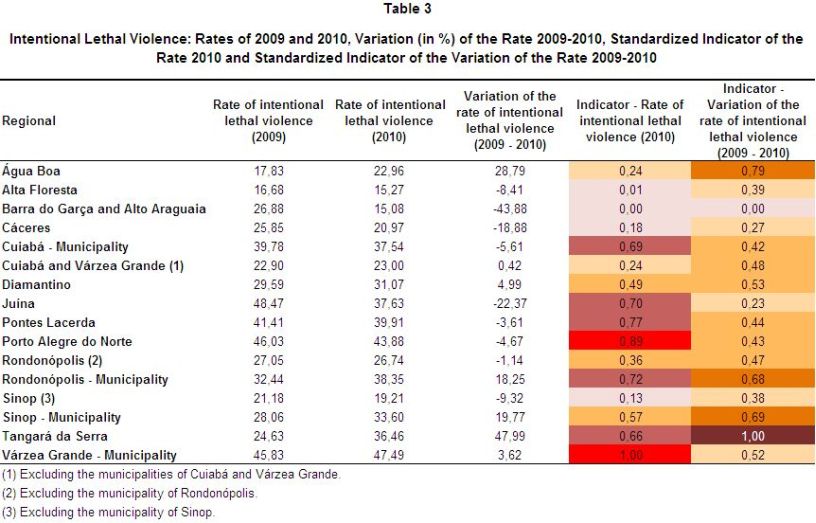
Table 3 and Maps 4 and 5 present a summary of the results obtained for the indicator associated with intentional lethal violence.
The regions that present a more critical situation in the levels of the rate of intentional lethal violence and in the variation of the indicator are located in the upper right of the scatter chart. The Várzea Grande municipality and Porto Alegre do Norte presented the worst levels in the standardized indicator in 2010, i.e., a very high intentional lethal violence rate, as shown in Table 3 and in Map 4.
Other regions presented a critical situation due to high levels of variation in the indicator rate and the “bad” or “regular” situation registered on the indicator. Such is the case of Tangará da Serra, Rondonopolis municipality and Sinop municipality. The situation of these regions in the variation of the intentional lethal violence rate can be seen in Map 5.
It is also important to highlight the situatiion of the Água Boa region that, despite presenting a rate performance of “good-middling,” registered an increase on this indicator from 2009 to 2010.
In terms of cutting rates, the Juina region stands in the upper left quadrant of the scatter chart. Its position seems to denote an effort in that region to reduce the high rate of intentional lethal violence that was still present in 2010.
Finally, we should highlight the regions that presented a more positive framework, combining low levels of the indicator and an improvement in rates from 2009 to 2010, namely: the aggregate area of Barra do Garças and Alto Araguaia (which presented a significant rate decrease), Alta Floresta, Sinop and Cáceres.
.
Map 4
Standardized Indicator of the Variation Rate of Intentional Lethal Violence 2010
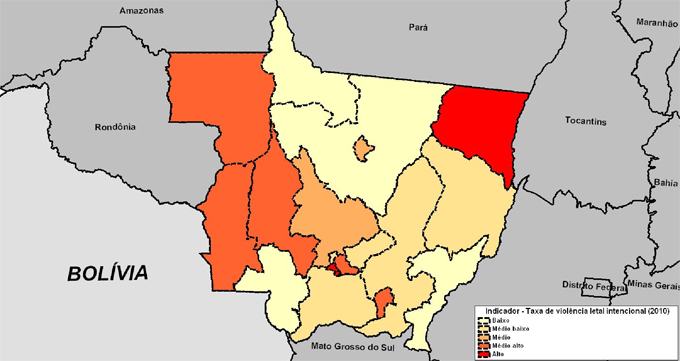
Note: Low = Up to 0.2, Medium Low = More than 0.2 to 0.4, Medium = More than 0.4 to 0.6; Medium High = More than 0.6 to 0.8, High = More than 0.8.
Map 5
Standardized Indicator of the Variation Rate of Intentional Lethal Violence 2009-2010

Note: Low = Up to 0.2, Medium Low = More than 0.2 to 0.4, Medium = More than 0.4 to 0.6; Medium High = More than 0.6 to 0.8, High = More than 0.8.