3.2. Standardized Indicator of the Rate of Women Homicides 2010 and the Variation Rate of Women Homicides 2009-2010
The analysis of this indicator notes the intentional violent deaths against women occurred in 2010 and the variation of this indicator in each region compared to the previous, i.e., from 2009 to 2010. It considers the number of deaths of females for every 100 000 women and include deaths due to intentional aggression of others, using any means to cause harm, injury or death of the victim. Figure 6, below, shows the location of region diagnosis according to the standardized indicator of the rate of 2010 and the variation of the rate from 2009 to 2010.
Figure 6
Correspondence between the Standardized Indicator of the Rate of Women's Homicides in 2010 and the Variation Rate of Women's Homicides 2009-2010
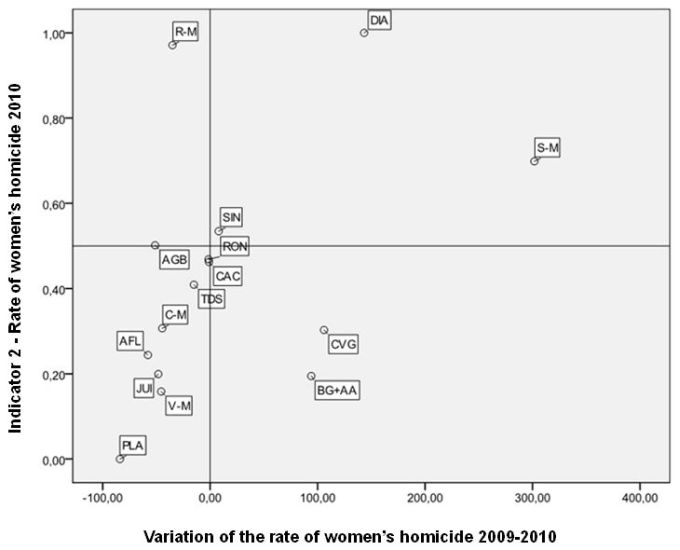
Source: Health Department of the State of Mato Grosso.
Note: AGB = Água Boa, AFL = Alta Floresta, BG + AA = Barra do Garças + Alto Araguaia, CAC = Cáceres, C-M = Cuiabá – Municipality, CVG = Cuiabá e Várzea Grande, DIA = Diamantino, JUI = Juina, PLA = Pontes Lacerda, PAN = Porto Alegre do Norte, RON = Rondonópolis, R-M = Rondonópolis – Municipality, SIN = Sinop, S-M = Sinop – Municipality, TDS = Tangará da Serra, V-M = Várzea Grande – Municipality.
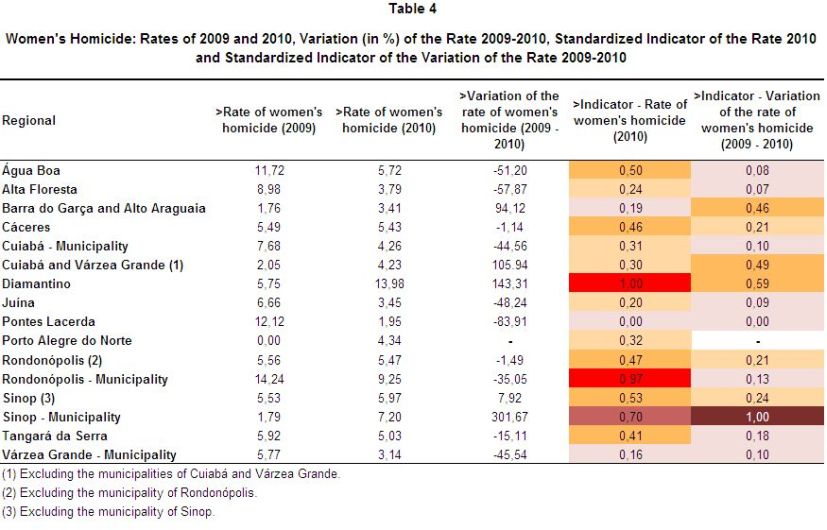
Table 4 and Maps 6 and 7 present a summary of the results obtained for the indicator of women’s homicide.
Regions with the situation more critical in this indicator — with high rates of women homicide and an increase in rates from 2009 to 2010 — are in the right upper quadrant of the scatter chart. There are two (02) regions: Diamantino and Sinop municipality. The region of Diamantino has the highest murder rate of women in the state, as shown in Table 4 and Map 6. Besides the high rate of this type of victimization, Diamantino also showed a large deterioration in this indicator between 2009 and 2010. An even more critical frame is configured at Sinop. Such region features show not only a high rate of homicides of women, but also a strong increase in this rate from 2009 to 2010 (see Map 7).
Also noteworthy is the location of the City of Rondonopolis in the left upper quadrant of the scatter chart. The city has a very high rate of women homicide in 2010 (the second highest in the state). At the same time there was an improvement in this indicator, i.e. a decrease in women homicide 2009 to 2010 as shown in Table 4.
The regions of Cuiabá, Várzea Grande and Barra do Garças and Alto Araguaia had relatively low rates of women’s homicide, registered increase in the incidence of events between 2009 and 2010.
Regions with a relatively more satisfactory frame, combining low levels of the indicator and a substantial improvement in rates from 2009 to 2010, are located in the left lower quadrant of the scatter chart. They are the regionals Ponte Lacerda, Várzea Grande-Municipality and Juína.
Map 6
Standardized Indicator of the Rate of Women's Homicide 2010

Note: Low = Up to 0.2, Medium Low = More than 0.2 to 0.4, Medium = More than 0.4 to 0.6; Medium High = more than 0.6 to 0.8, High = more than 0.8
Map 7
Standardized Indicator of Variation Rate of Women’s Homicide 2009-2010

Note: Low = Up to 0.2, Medium Low = More than 0.2 to 0.4, Medium = More than 0.4 to 0.6; Medium High = more than 0.6 to 0.8, High = more than 0.8