3.4. Standardized Indicator of the Rate of Youth Homicide from 19 to 29 Years-Old and the Variation Rate of Youth Homicide from 19 to 29 Years-Old, 2009-2010
This indicator is similar to previous estimates about the intentional violent deaths committed against more vulnerable specific age groups. However, it considers the number of deaths of young people (from 19 to 29 years old) for every 100,000 inhabitants in this age group and includes deaths due to intentional aggression of others, using any means to cause harm, injury or death of the victim. The analysis of this indicator notes the intentional violent deaths in 2010 incurred against young people and the variation of this indicator in each region compared to the previous, i.e., from 2009 to 2010.
Figure 8, below, shows the location of diagnosis regions according to the standardized indicator of the rate of 2010 and the rate variation from 2009 to 2010.
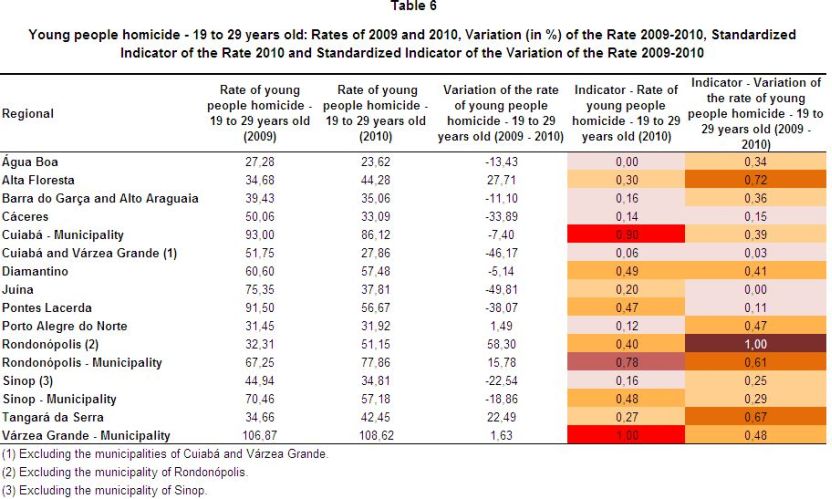
The municipalities of Várzea Grande, Cuiabá and Rondonopolis have a situation of “very bad” because of the high relative rates of youth homicides in 2010. As shown in Figure 8 and Table 6, the Várzea Grande municipality and the municipality of Cuiabá presented the largest values for the standard indicator.
Regarding the trajectory or changes of this situation for these areas, the standarized indicator of the variation showed an “unsatisfactory” or “middling” performance, as shown in Map 11. That is, no significant improvements were observed in the context. In addition, the municipality of Rondonopolis, which is also in a critical situation, not only showed high levels of youth homicides — it is classified as “poor” in this dimension —as its performance also worsened from 2009 to 2010.
Regarding the temporal evolution of this indicator, the Rondonopolis region, mainly the regions of Alta Floresta and Tangara da Serra, show cause for concern. These regions, located in the right lower quadrant of the scatter chart below, showed an increased rate in homicide of young people from 2009 to 2010, as shown in Table 6, and the region of Rondonopolis (excluding the municipality of Rondonopolis) presented the largest increase in the state in the period.
Figure 8
Correspondence Between the Standardized Indicator of the Rate of Youth Homicide from 19 to 29 Years Old and the Variation of the Rate of Youth Homicide from 19 to 29 Years Old 2009-2010
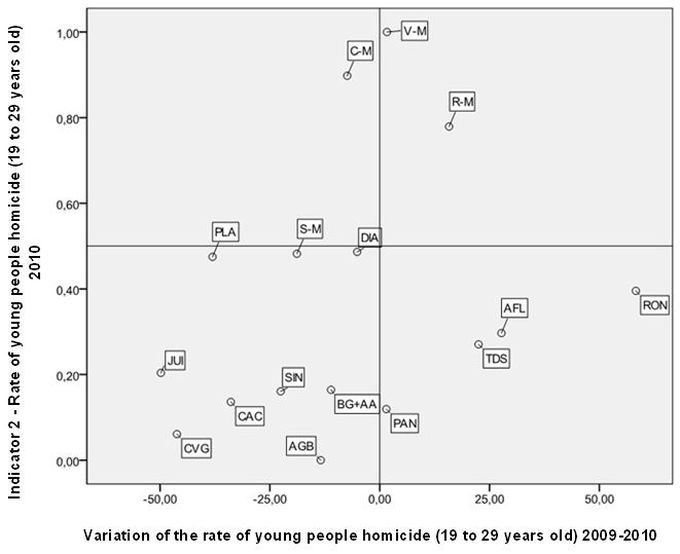
Source: Health Department of the State of Mato Grosso.
Note: AGB = Água Boa, AFL = Alta Floresta, BG + AA = Barra do Garças + Alto Araguaia, CAC = Cáceres, C-M = Cuiabá – Município, CVG = Cuiabá e Várzea Grande, DIA = Diamantino, JUI = Juina, PLA = Pontes Lacerda, PAN = Porto Alegre do Norte, RON = Rondonópolis, R-M = Rondonópolis – Municipality, SIN = Sinop, S-M = Sinop – Municipality, TDS = Tangará da Serra, V-M = Várzea Grande – Municipality.
In the opposite direction, we highlight the regions of Cuiabá and Várzea Grande (excluding the host municipalities), Cáceres, Juína, Sinop (excluding the municipality of Sinop) and Água Boa, which showed a decreased of rates of homicide among youth between 2009 and 2010. Moreover, as can be noted on Figure 8, those regions had levels of youth homicides in 2010 ranging from “low” (Cuiaba and Várzea Grande and Água Boa) to “moderate” (Cáceres, Sinop and Juína).
Map 10
Standardized Indicator of the Rate of Youth Homicide from 19 to 29 Years Old 2010
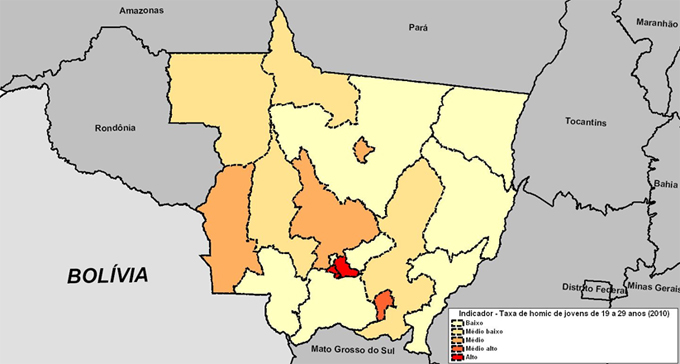
Note: Low = Up to 0.2, Medium Low = More than 0.2 to 0.4, Medium = More than 0.4 to 0.6; Medium High = more than 0.6 to 0.8, High = more than 0.8
Map 11
Standardized Indicator of the Variation Rate of Youth Homicide from 19 to 29 Years Old 2009-2010
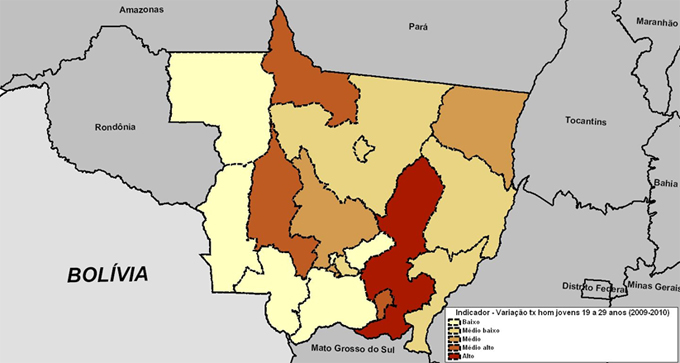
Note: Low = Up to 0.2, Medium Low = More than 0.2 to 0.4, Medium = More than 0.4 to 0.6;Medium High = more than 0.6 to 0.8, High = more than 0.8