3.5. Standardized Indicator of the Rate of Unintentional Lethal Violence in Traffic 2010 and the Variation Rate of Unintentional Lethal Violence in Traffic 2009-2010
The analysis of the indicator observes the risk of deaths from traffic accidents that occurred in 2010 and the variation of this indicator in each region compared to the previous, i.e., from 2009 to 2010. It considers the number of deaths per 100,000 inhabitants and includes homicides in traffic and accidental deaths in traffic.
Figure 9 below shows the location of regional diagnosis according to standardized indicator of the rate of 2010 and the rate variation from 2009 to 2010.
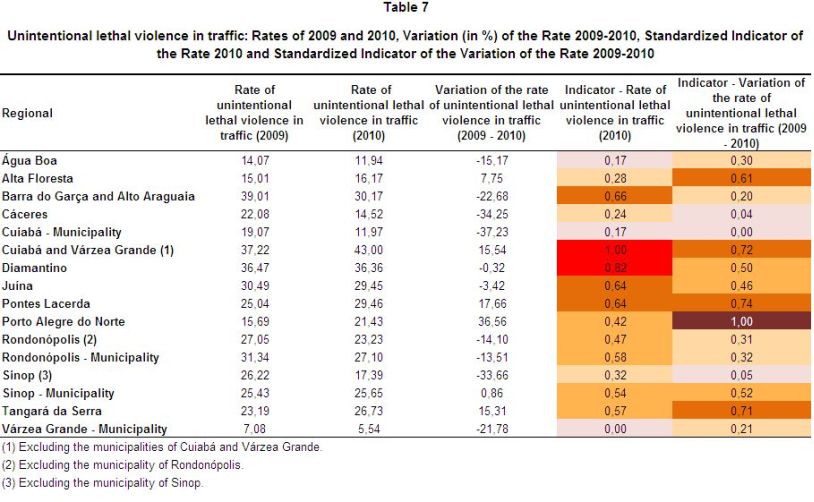
The regions that presented more critical situations on levels of lethal unintentional violence in traffic rate and on the variation in this indicator are located in the upper right of the scatter chart. In this more critical group we find the regions of Cuiabá and Várzea Grande, Pontes Lacerda and Tangará da Serra. The most worrying related to deaths resulting from traffic accidents are the Cuiabá and the Várzea Grande regions, which had the highest rates in the state in 2010 and a significant increase of this indicator from 2009 to 2010, as shown in Table 7. Although the Pontes Lacerda region shows a level of “medium high” of the indicator in 2010, it is also in a delicate situation, because it showed a large increase for this rate from 2009 to 2010.
The Diamantino region also recorded high levels of lethal violence in traffic — as of 2010, the second-worst in the state. However, from 2009 to 2010, this indicator remained virtually unchanged in this region, as shown in Table 7.
Figure 9
Correspondence Between the Standardized Indicator of the Rate of Unintentional Lethal Violence in Traffic 2010 and the Variation Rate of Unintentional Lethal Violence in Traffic 2009-2010
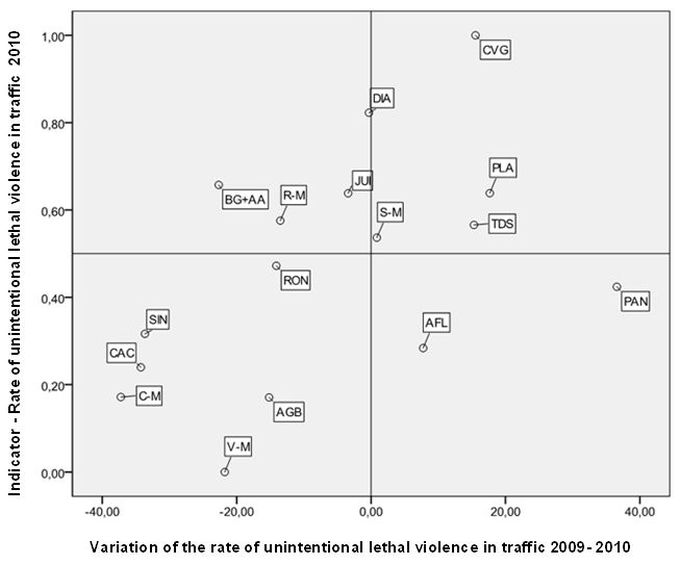
Source: Judicial Police of the State of Mato Grosso
Note: AGB = Água Boa, AFL = Alta Floresta, BG + AA = Barra do Garças + Alto Araguaia, CAC = Cáceres, C-M = Cuiabá – Municipality, CVG = Cuiabá e Várzea Grande, DIA = Diamantino, JUI = Juina, PLA = Pontes Lacerda, PAN = Porto Alegre do Norte, RON = Rondonópolis, R-M = Rondonópolis – Municipality, SIN = Sinop, S-M = Sinop – Municipality, TDS = Tangará da Serra, V-M = Várzea Grande – Municipality
The region of Tangará da Serra and Porto Alegre do Norte present worrying situations. Located in the center-right of the scatter chart above, they showed high growth in traffic deaths between 2009 and 2010, and also registered, in 2010, less than satisfactory levels in the indicator standard rate.
We observe, in contrast, the regions that had poor or unsatisfactory levels in this rate improved their situation from 2009 to 2010. As shown in Figure 9 (upper left), the Barra do Garças region and Alto Araguaia and Rondonopolis municipality are in this situation. Their position seems to reveal an effort of those areas to reduce their high or unsatisfactory rates of violence in traffic observed in the period under discussion.
Finally, we highlight the regions that have a relatively more satisfactory frame, combining low levels of the indicator and a considerable improvement in rates from 2009 to 2010, namely: the regions of Cuiabá municipality, Várzea Grande municipality and Cáceres. We highlight the situation of the City of Cuiabá, as shown in Table 7, that had a strong fall in the rate of traffic fatalities and kept it at low levels in 2010. The Cáceres region also showed, in the analyzed period, a sharp drop in this rate.
A summary of results for the indicator is shown in Table 7 and Maps 12 and 13 below.
Map 12
Standardized Indicator of the Rate of Unintentional Lethal Violence in Traffic 2010
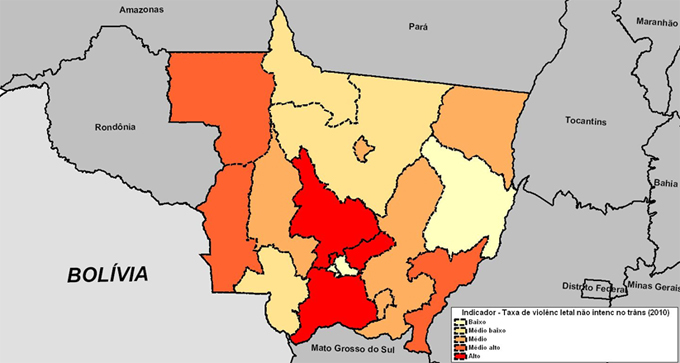
Note: Low = Up to 0.2, Medium Low = More than 0.2 to 0.4, Medium = More than 0.4 to 0.6; Medium High = more than 0.6 to 0.8, High = more than 0.8
Map 13
Standardized Indicator of the Variation Rate of Unintentional Lethal Violence in Traffic 2009-2010
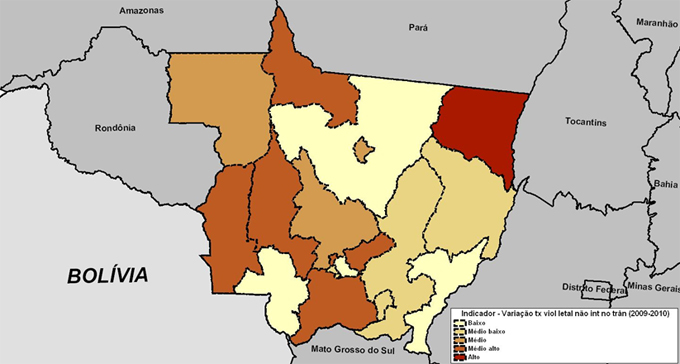
Note: Low = Up to 0.2, Medium Low = More than 0.2 to 0.4, Medium = More than 0.4 to 0.6; Medium High = more than 0.6 to 0.8, High = more than 0.8