3.7. Standardized Indicator of the Rate of Property Crimes (Except Vehicles) 2010 and the Variation Rate of Property Crimes (Except Vehicles) 2009-2010
The analysis of this specific indicator estimates the property crimes with or without the use of violence and/or threat that occurred in 2010 and the variation of this indicator in each region in the previous year, i.e., 2009 to 2010, and do not include vehicle theft.
Figure 11 below shows the regional location of diagnosis according to standardized indicator of the rate of 2010 and the variation rate from 2009 to 2010.
Figure 11
Correspondence Between the Standardized Indicator of the Rate of Property Crimes (except Vehicles) 2010 and the Variation Rate of Property Crimes (except Vehicles) 2009-2010
(except Vehicles) 2009-2010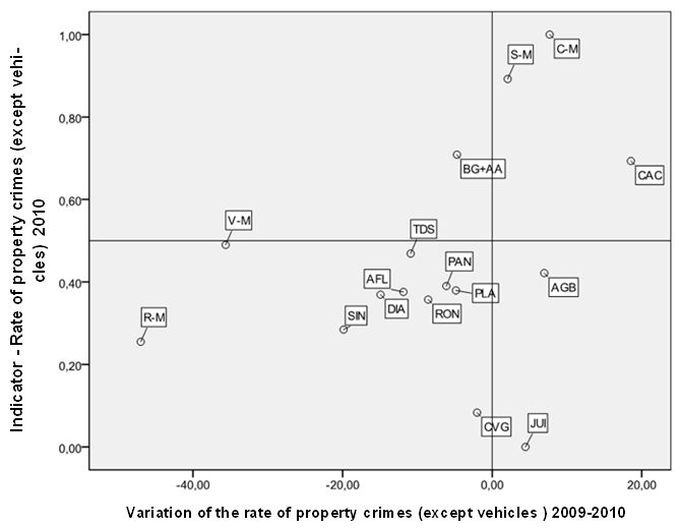
Source: Judicial Police of the State of Mato Grosso
Note: AGB = Água Boa, AFL = Alta Floresta, BG + AA = Barra do Garças + Alto Araguaia, CAC = Cáceres, C-M = Cuiabá – Municipality, CVG = Cuiabá and Várzea Grande, DIA = Diamantino, JUI = Juina, PLA = Pontes Lacerda, PAN = Porto Alegre do Norte, RON = Rondonópolis, R-M = Rondonópolis – Municipality, SIN = Sinop, S-M = Sinop – Municipality, TDS = Tangará da Serra, V-M = Várzea Grande – Municipality
The regions that show the most critical situation in the levels of criminality and the variation of the indicator are located in the upper-right of the scatter chart above. This more critical group includes the Sinop municipality, the Cuiaba municipality, and Caceres. Among these, the municipality of Cuiabá presents the worst situation, with criminality rates related to property, the highest in the state, beyond the second largest variation rate between 2009 and 2010. Cáceres was the region with a more pronounced increase in robbery and theft in the observed period.
Also noteworthy are two regions with “antagonistic” situations related to this indicator: the regions of Água Boa and Barra do Garças and Alto Araguaia. In the first case, although it is in a “middling” situation with respect to the rate of 2010, there was an increase for this indicator from 2009 to 2010. As for the second, there seems to be an “effort” to combat crime in the region, since, although it still exhibited a regional level of “medium high” in the indicator in 2010, there is a decreased rate of property crimes between 2009 and 2010.
Finally, we highlight the municipalities of Várzea Grande and Rondonopolis, because they are the regions with the most significant reduction of property crime in the State of Mato Grosso. However, in the municipality of Várzea Grande, the level in the indicator in 2010 was still at a place of only “middling” or “unsatisfactory.”
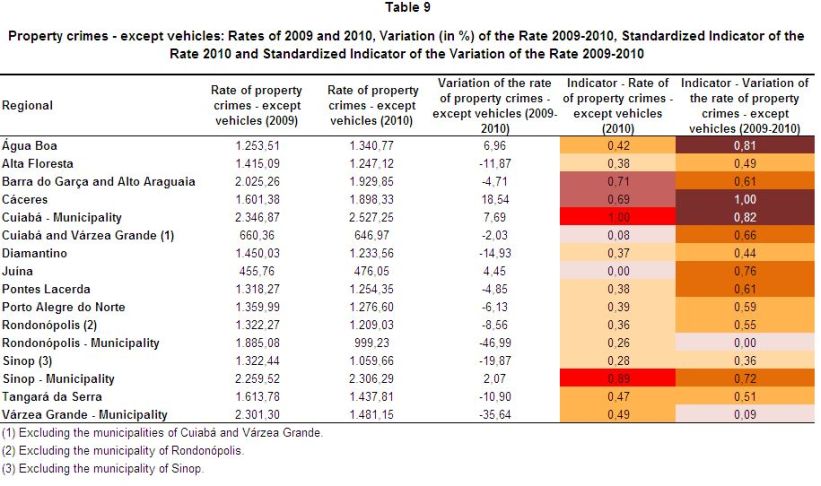
A summary of results for the indicator is in Table 9 and Maps 16 and 17 below.
Map 16
Standardized Indicator of the Rate of Property Crimes - Except Vehicles 2010
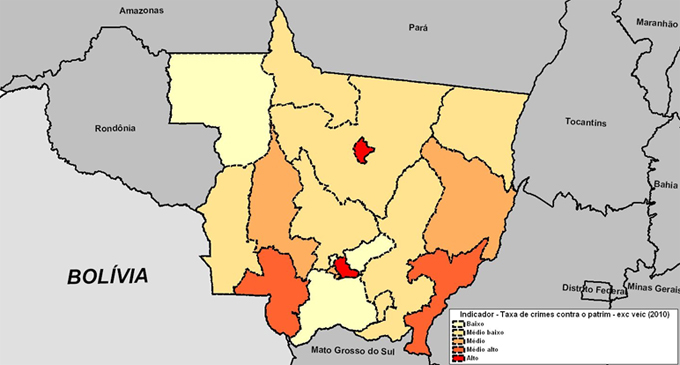
Note: Low = Up to 0.2, Medium Low = More than 0.2 to 0.4, Medium = More than 0.4 to 0.6; Medium High = More than 0.6 to 0.8, High = more than 0.8.
Map 17
Standardized Indicator of the Variation Rate of Property Crimes - Except Vehicles 2009-2010
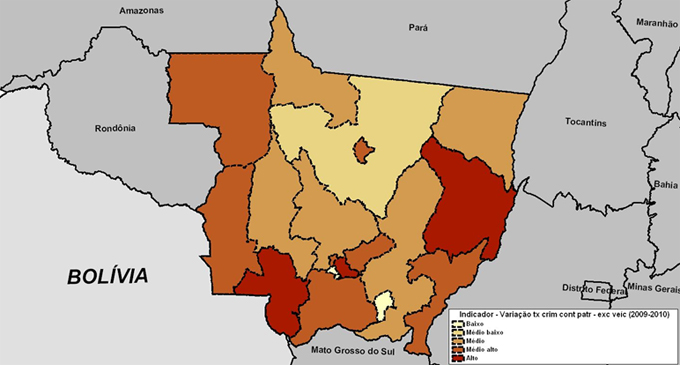
Note: Low = Up to 0.2, Medium Low = More than 0.2 to 0.4, Medium = More than 0.4 to 0.6; Medium High = More than 0.6 to 0.8, High = more than 0.8.